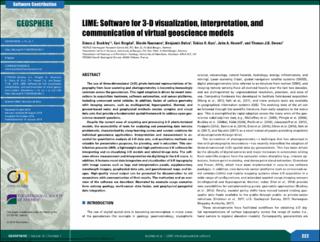
LIME: Software for 3-D visualization, interpretation, and communication of virtual geoscience models
| dc.contributor.author | Buckley, Simon John | |
| dc.contributor.author | Ringdal, Kari | |
| dc.contributor.author | Naumann, Nicole | |
| dc.contributor.author | Dolva, Benjamin | |
| dc.contributor.author | Kurz, Tobias Herbert | |
| dc.contributor.author | Howell, John Anthony | |
| dc.contributor.author | Dewez, Thomas J.B. | |
| dc.date.accessioned | 2020-04-03T13:59:02Z | |
| dc.date.available | 2020-04-03T13:59:02Z | |
| dc.date.created | 2019-01-16T09:10:53Z | |
| dc.date.issued | 2019 | |
| dc.identifier.issn | 1553-040X | |
| dc.identifier.uri | https://hdl.handle.net/11250/2650385 | |
| dc.description.abstract | The use of three-dimensional (3-D), photo-textured representations of topography from laser scanning and photogrammetry is becoming increasingly common across the geosciences. This rapid adoption is driven by recent innovations in acquisition hardware, software automation, and sensor platforms, including unmanned aerial vehicles. In addition, fusion of surface geometry with imaging sensors, such as multispectral, hyperspectral, thermal, and ground-based radar, and geophysical methods creates complex and visual data sets that provide a fundamental spatial framework to address open geoscience research questions. Despite the current ease of acquiring and processing 3-D photo-textured models, the accessibility of tools for analyzing and presenting data remains problematic, characterized by steep learning curves and custom solutions for individual geoscience applications. Interpretation and measurement is essential for quantitative analysis of 3-D data sets, and qualitative methods are valuable for presentation purposes, for planning, and in education. This contribution presents LIME, a lightweight and high-performance 3-D software for interpreting and co-visualizing 3-D models and related image data. The software allows measurement and interpretation via digitizing in the 3-D scene. In addition, it features novel data integration and visualization of 3-D topography with image sources such as logs and interpretation panels, supplementary wavelength imagery, geophysical data sets, and georeferenced maps and images. High-quality visual output can be generated for dissemination to aid researchers with communication of their results. The motivation and an overview of the software are described, illustrated by example usage scenarios from outcrop geology, multi-sensor data fusion, and geophysical-geospatial data integration. | |
| dc.language.iso | eng | |
| dc.rights | CC BY 4.0 | |
| dc.rights | CC-BY-NC | |
| dc.rights.uri | https://creativecommons.org/licenses/by/4.0/ | |
| dc.rights.uri | https://creativecommons.org/licenses/by-nc/2.0/ | |
| dc.title | LIME: Software for 3-D visualization, interpretation, and communication of virtual geoscience models | |
| dc.type | Peer reviewed | |
| dc.type | Journal article | |
| dc.description.version | publishedVersion | |
| cristin.ispublished | true | |
| cristin.fulltext | original | |
| cristin.qualitycode | 1 | |
| dc.identifier.doi | https://doi.org/10.1130/GES02002.1 | |
| dc.identifier.cristin | 1657821 | |
| dc.source.journal | Geosphere | |
| dc.source.volume | 15 | |
| dc.source.issue | 1 | |
| dc.relation.project | Norges forskningsråd: 266740 | |
| dc.relation.project | Norges forskningsråd: 234111 |
Tilhørende fil(er)
Denne innførselen finnes i følgende samling(er)

Med mindre annet er angitt, så er denne innførselen lisensiert som CC BY 4.0